
Since the beginning of observations by satellite-borne multichannel passive microwave sensors in late 1978, Antarctic Sea Ice Extent (SIE) has been increasing (Parkinson&Cavalieri 2012; Fetterer et al. 2017), sharply contrasting with the rapid reduction of Arctic sea ice, and despite the strong increase in global temperature during the last few decades (Rohde et al. 2013).
From November 1978 to December 2015 a slight positive trend of 1.7%/decade has been reported (Comiso et al. 2017) in Antarctic SIE. Regionally, the Ross Sea exhibits the most positive trend, whereas the Bellinghausen-Amundsen Seas are the only region with a negative trend. Autumn is the season when highest positive trends are observed, while spring exhibits the lowest positive trend. These regional and seasonal SIE trends correlate well with the observed regional and seasonal surface air temperatures (Comiso et al. 2017; Fan et al. 2014; Shu et al. 2012) and are also related with atmospheric circulation variability (Turner et al. 2015).
Antarctic SIE shows a strong interannual variability. For instance, the highest maximum during the satellite era was reached in 2014, whereas just two years later the maximum was the earliest and one ot the lowest of the satellite era. Moreover, during spring 2016 Antarctic SIE plummeted faster than any other year in the satellite record, possibly due to atmospheric variability (Turner et al. 2018).
Longer time series of sea ice observations are needed in order to put these striking interannual variations and the positive trend of Antarctic SIE over the satellite era in a wider climatic context. The analysis can be extended back to 1973 by using single-channel passive microwave ESMR observations (Cavalieri et al. 2003). The early visible and infrared satellite imagery from 1964 onward could also be useful to create longer time series. Visual imagery from the early Nimbus satellites has been recently recovered. Relying on these images, Antarctic SIE has been estimated for winter 1964, 1966 and 1969 (Gallaher et al. 2014; Gallaher & Campbell 2014; Meier et al. 2013).
In addition, there are also several Antarctic SIE estimates for some years and months of the 1960s and 1970s (Predoehl 1966; Treshnikov 1967; Streten 1973; Budd 1975) although they are not continuous, nor consistent between them and therefore may not be useful to develop a longer time series of Antarctic SIE.
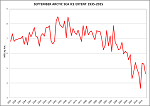
However, a continuous time series of late November Antarctic SIE from 1967 to 1976 is available too (Fig.4 from Ackley 1981, after Kukla et al. 1977).

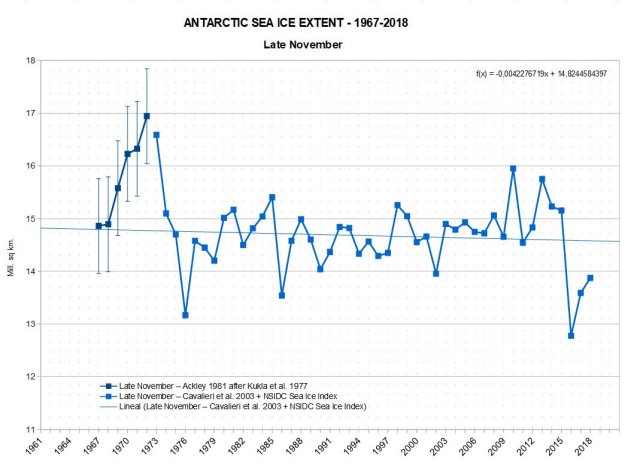
This record is particularly interesting and useful because it is the only one that crosses the boundary at 1972/1973 between visual imagery and passive microwave data. The 1973-1976 late November data presented in this record match closely those provided by Cavalieri for November 25th. Therefore, a continuous and consistent record of late November Antarctic SIE from 1967 to present can be created:

The almost flat trend for late November SIE during the multi-channel passive microwave satellite record (remember that spring is the season that exhibits the lowest positive trend), becomes a slight negative trend (-0.96%/decade relative to the 1967 to 1996 average) when data from 1967 onward are added, due to the high SIE in the late 1960s and early 1970s. However, this trend should be taken with caution due to the wider error margins in the earlier part of the record. Perhaps the most striking feature on this record is the strong interannual variability.
The upward trend during the second half of the 1960s that can be seen in the graph above has been previously reported (Zwally et al. 1983). It is worth mentioning it has also been suggested that Antarctic SIE during the 1967-1976 interval was higher than in the late 1950s (Kukla et al. 1977; Treshnikov 1967). This would suggest an almost flat trend in Antarctic SIE over the last 60 years.
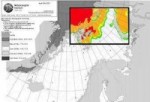
In addition to the useful spring record provided by Ackley, an estimate of Antarctic SIE for late August-early September in 1964, 1966 and 1969 can be calculated by using the sea ice edge points derived from Nimbus visible imagery presented by Gallaher (https://doi.org/10.5067/NIMBUS/NmIcEdg2). The graph below shows these estimates along a 1973-2018 time series that combines data from single-channel and multichannel passive microwave sensors:
 The slight positive trend during 1979-2018 (+0.37% per decade relative to the 1981 to 2010 average) becomes almost completely flat when data from 1973 onward are added. Maybe the most striking feature is the extremely low SIE in 1966, which highlights again the strong interannual variability in Antarctic sea ice cover, and suggests an almost flat trend in winter Antarctic SIE during the last 50 years .
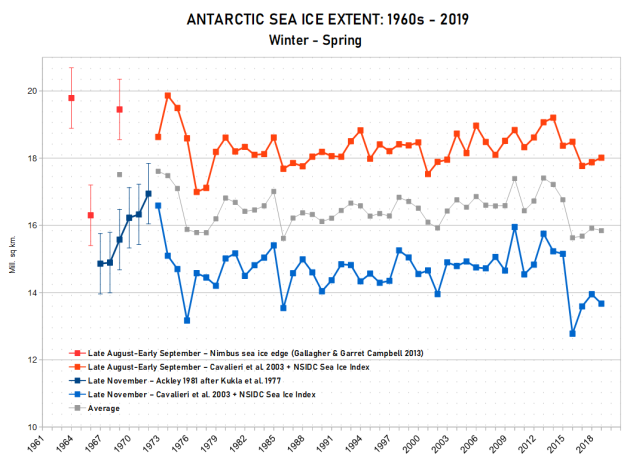
In the graph below, late August-early September data (red line and squares) are displayed along with the previously reported late November data (blue). In addition, the graph also shows an average of the two values (grey) in the years when both are available:

The peak in the early 1970s looks higher than the recent one around 2014. However, in the late 1970s some of the lowest years on record are found too. It seems that in the 1960s the interannual variability was very strong as well, with high years (1964) but a very low SIE in 1966 too. Despite this strong interannual variability, overall the trend in winter and spring Antarctic SIE during the last 50 years looks almost flat.
REFERENCES:
Ackley, S. F. (1981). A review of sea-ice weather relationships in the Southern Hemisphere. Sea Level, Ice, and Climatic Change (Proceedings of the Canberra Symposium, December 1979). IAHS Publ. no. 131, pp.127-159. https://www.researchgate.net/profile/Stephen-Ackley/publication/254221410_A_review_of_sea-ice_weather_relationships_in_the_Southern_Hemisphere/links/004635356b2d48b8cb000000/A-review-of-sea-ice-weather-relationships-in-the-Southern-Hemisphere.pdf
Budd, W. F. (1975). Antarctic sea-ice variations from satellite sensing in relation to climate. Journal of Glaciology, 15(73), 417-427.
Comiso, J. C., Gersten, R. A., Stock, L. V., Turner, J., Perez, G. J., & Cho, K. (2017). Positive trend in the Antarctic sea ice cover and associated changes in surface temperature. Journal of Climate, 30(6), 2251-2267.
, , and (2003), 30-Year satellite record reveals contrasting Arctic and Antarctic decadal sea ice variability, Geophys. Res. Lett., 30, 1970, doi:10.1029/2003GL018031, 18.
Fan, T., Deser, C., & Schneider, D. P. (2014). Recent Antarctic sea ice trends in the context of Southern Ocean surface climate variations since 1950. Geophysical Research Letters, 41(7), 2419-2426.
Fetterer, F., K. Knowles, W. Meier, M. Savoie, and A. K. Windnagel. 2017, updated daily. Sea Ice Index, Version 3. Boulder, Colorado USA. NSIDC: National Snow and Ice Data Center. doi: https://doi.org/10.7265/N5K072F8.
Gallaher, D. W., Campbell, G. G., & Meier, W. N. (2014). Anomalous variability in Antarctic sea ice extents during the 1960s with the use of Nimbus data. IEEE Journal of Selected Topics in Applied Earth Observations and Remote Sensing, 7(3), 881-887.
Gallaher, D. and G. Campbell. 2014. Nimbus Ice Edge Points from Nimbus Visible Imagery L2, CSV, Version 1. Boulder, Colorado USA. NASA National Snow and Ice Data Center Distributed Active Archive Center. doi: https://doi.org/10.5067/NIMBUS/NmIcEdg2.
Kukla, G. J. et al. (1977). New data on climatic trends. Nature, 270, 573-580. http://www.nature.com/nature/journal/v270/n5638/abs/270573a0.html
Meier, W. N., Gallaher, D., & Campbell, G. G. (2013). New estimates of Arctic and Antarctic sea ice extent during September 1964 from recovered Nimbus I satellite imagery. The Cryosphere, 7(2), 699-705.
Parkinson, C. L., & Cavalieri, D. J. (2012). Antarctic sea ice variability and trends, 1979-2010.
Predoehl, M. C. (1966). Antarctic pack ice: boundaries established from Nimbus I pictures. Science, 153(3738), 861-863.
Rohde, R., Muller, R. A., Jacobsen, R., Muller, E., Perlmutter, S., Rosenfeld, A., … & Wickham, C. (2013). A new estimate of the average Earth surface land temperature spanning 1753 to 2011. Geoinfor Geostat Overview 1: 1. of, 7, 2.
Shu, Q., Qiao, F., Song, Z., & Wang, C. (2012). Sea ice trends in the Antarctic and their relationship to surface air temperature during 1979–2009. Climate dynamics, 38(11-12), 2355-2363.
Streten, N.A. Arch. Met. Geoph. Biokl. A. (1973) 22: 119. doi:10.1007/BF02247676 http://link.springer.com/article/10.1007/BF02247676
Turner, J., Phillips, T., Marshall, G. J., Hosking, J. S., Pope, J. O., Bracegirdle, T. J., & Deb, P. (2017). Unprecedented springtime retreat of Antarctic sea ice in 2016. Geophysical Research Letters, 44(13), 6868-6875.
Turner, J., Hosking, J. S., Marshall, G. J., Phillips, T., & Bracegirdle, T. J. (2016). Antarctic sea ice increase consistent with intrinsic variability of the Amundsen Sea Low. Climate Dynamics, 46(7-8), 2391-2402.
Zwally, H. J., Parkinson, C. L., & Comiso, J. C. (1983). Variability of Antarctic Sea ice: and changes in carbon dioxide. Science, 220(4601), 1005-1012.


En castellano vine a contar más o menos lo mismo aquí: https://diablobanquisa.wordpress.com/2016/11/25/banquisa-antartica-2016-siglo-xx/
Gallaher & Garret Campbell: http://wiki.esipfed.org/images/3/37/DaveG_ESIP15_Nimbus.pptx
Late November record updated until 2018:
Late November record updated to 2019:

Late August – Early September record updated to 2019:

Winter-Spring graph updated to 2019:
Late November record updated to 2020

Late August-Early September record updated to 2021:
Fogt, R.L., Sleinkofer, A.M., Raphael, M.N. et al. A regime shift in seasonal total Antarctic sea ice extent in the twentieth century. Nat. Clim. Chang. 12, 54–62 (2022). https://doi.org/10.1038/s41558-021-01254-9
https://www.nature.com/articles/s41558-021-01254-9
In stark contrast to the Arctic, there have been statistically significant positive trends in total Antarctic sea ice extent since 1979. However, the short and highly variable nature of observed Antarctic sea ice extent limits the ability to fully understand the historical context of these recent changes. To meet this challenge, we have created robust, observation-based reconstruction ensembles of seasonal Antarctic sea ice extent since 1905. Using these reconstructions, here we show that the observed period since 1979 is the only time all four seasons demonstrate significant increases in total Antarctic sea ice in the context of the twentieth century and that the observed increases are juxtaposed against statistically significant decreases throughout much of the early and middle twentieth century. These reconstructions provide reliable estimates of seasonally resolved total Antarctic sea ice extent and are skilful enough to better understand aspects of air–sea–ice interactions within the Antarctic climate system.
a–d, Sea ice observations (black lines) are from the Climate Data Record (CDR) daily concentration fields from the National Oceanic and Atmospheric Administration / National Snow and Ice Data Center (NOAA/NSIDC) CDR of Passive Microwave Sea Ice Concentration, Version 4 (https://nsidc.org/data/g02202)43. The blue lines are the ensemble mean reconstructions acquired from the average of over 200,000 possible sums of seasonal sector-based sea ice extent reconstructions, and the grey shading approximates the reconstruction uncertainty as the greater of 1.96 times the standard deviation of the ensemble members or 1.96 times the standard deviation of the residuals of an individual best-fit reconstruction ensemble member. The seasons shown are DJF (a), March–May (MAM) (b), JJA (c) and SON (d).
Late November Antarctic sea ice extent from 1967 to 2021:
Late August – Early September record updated to 2022:
Late August – Early September record updated to 2023: